What is a cloudwatch custom metric?
Had someone ask me about amazon cloudwatch metrics - specifically, what counted as a custom metric
Cloudwatch counts every unique namespace + metric name + unique combination of dimensions + unit as a separate metric (eg. metric foo with dimensions bar=1 and metric foo with dimensions zip=1 are TWO different custom metrics because they have different dimensions).
I wanted to link to the AWS docs for the exact definition - thinking this would take just a moment. And that led me down a rabbit hole.
First, I navigated to the billing page. This goes into detail about how much a custom metric cost but not what a custom metric is.
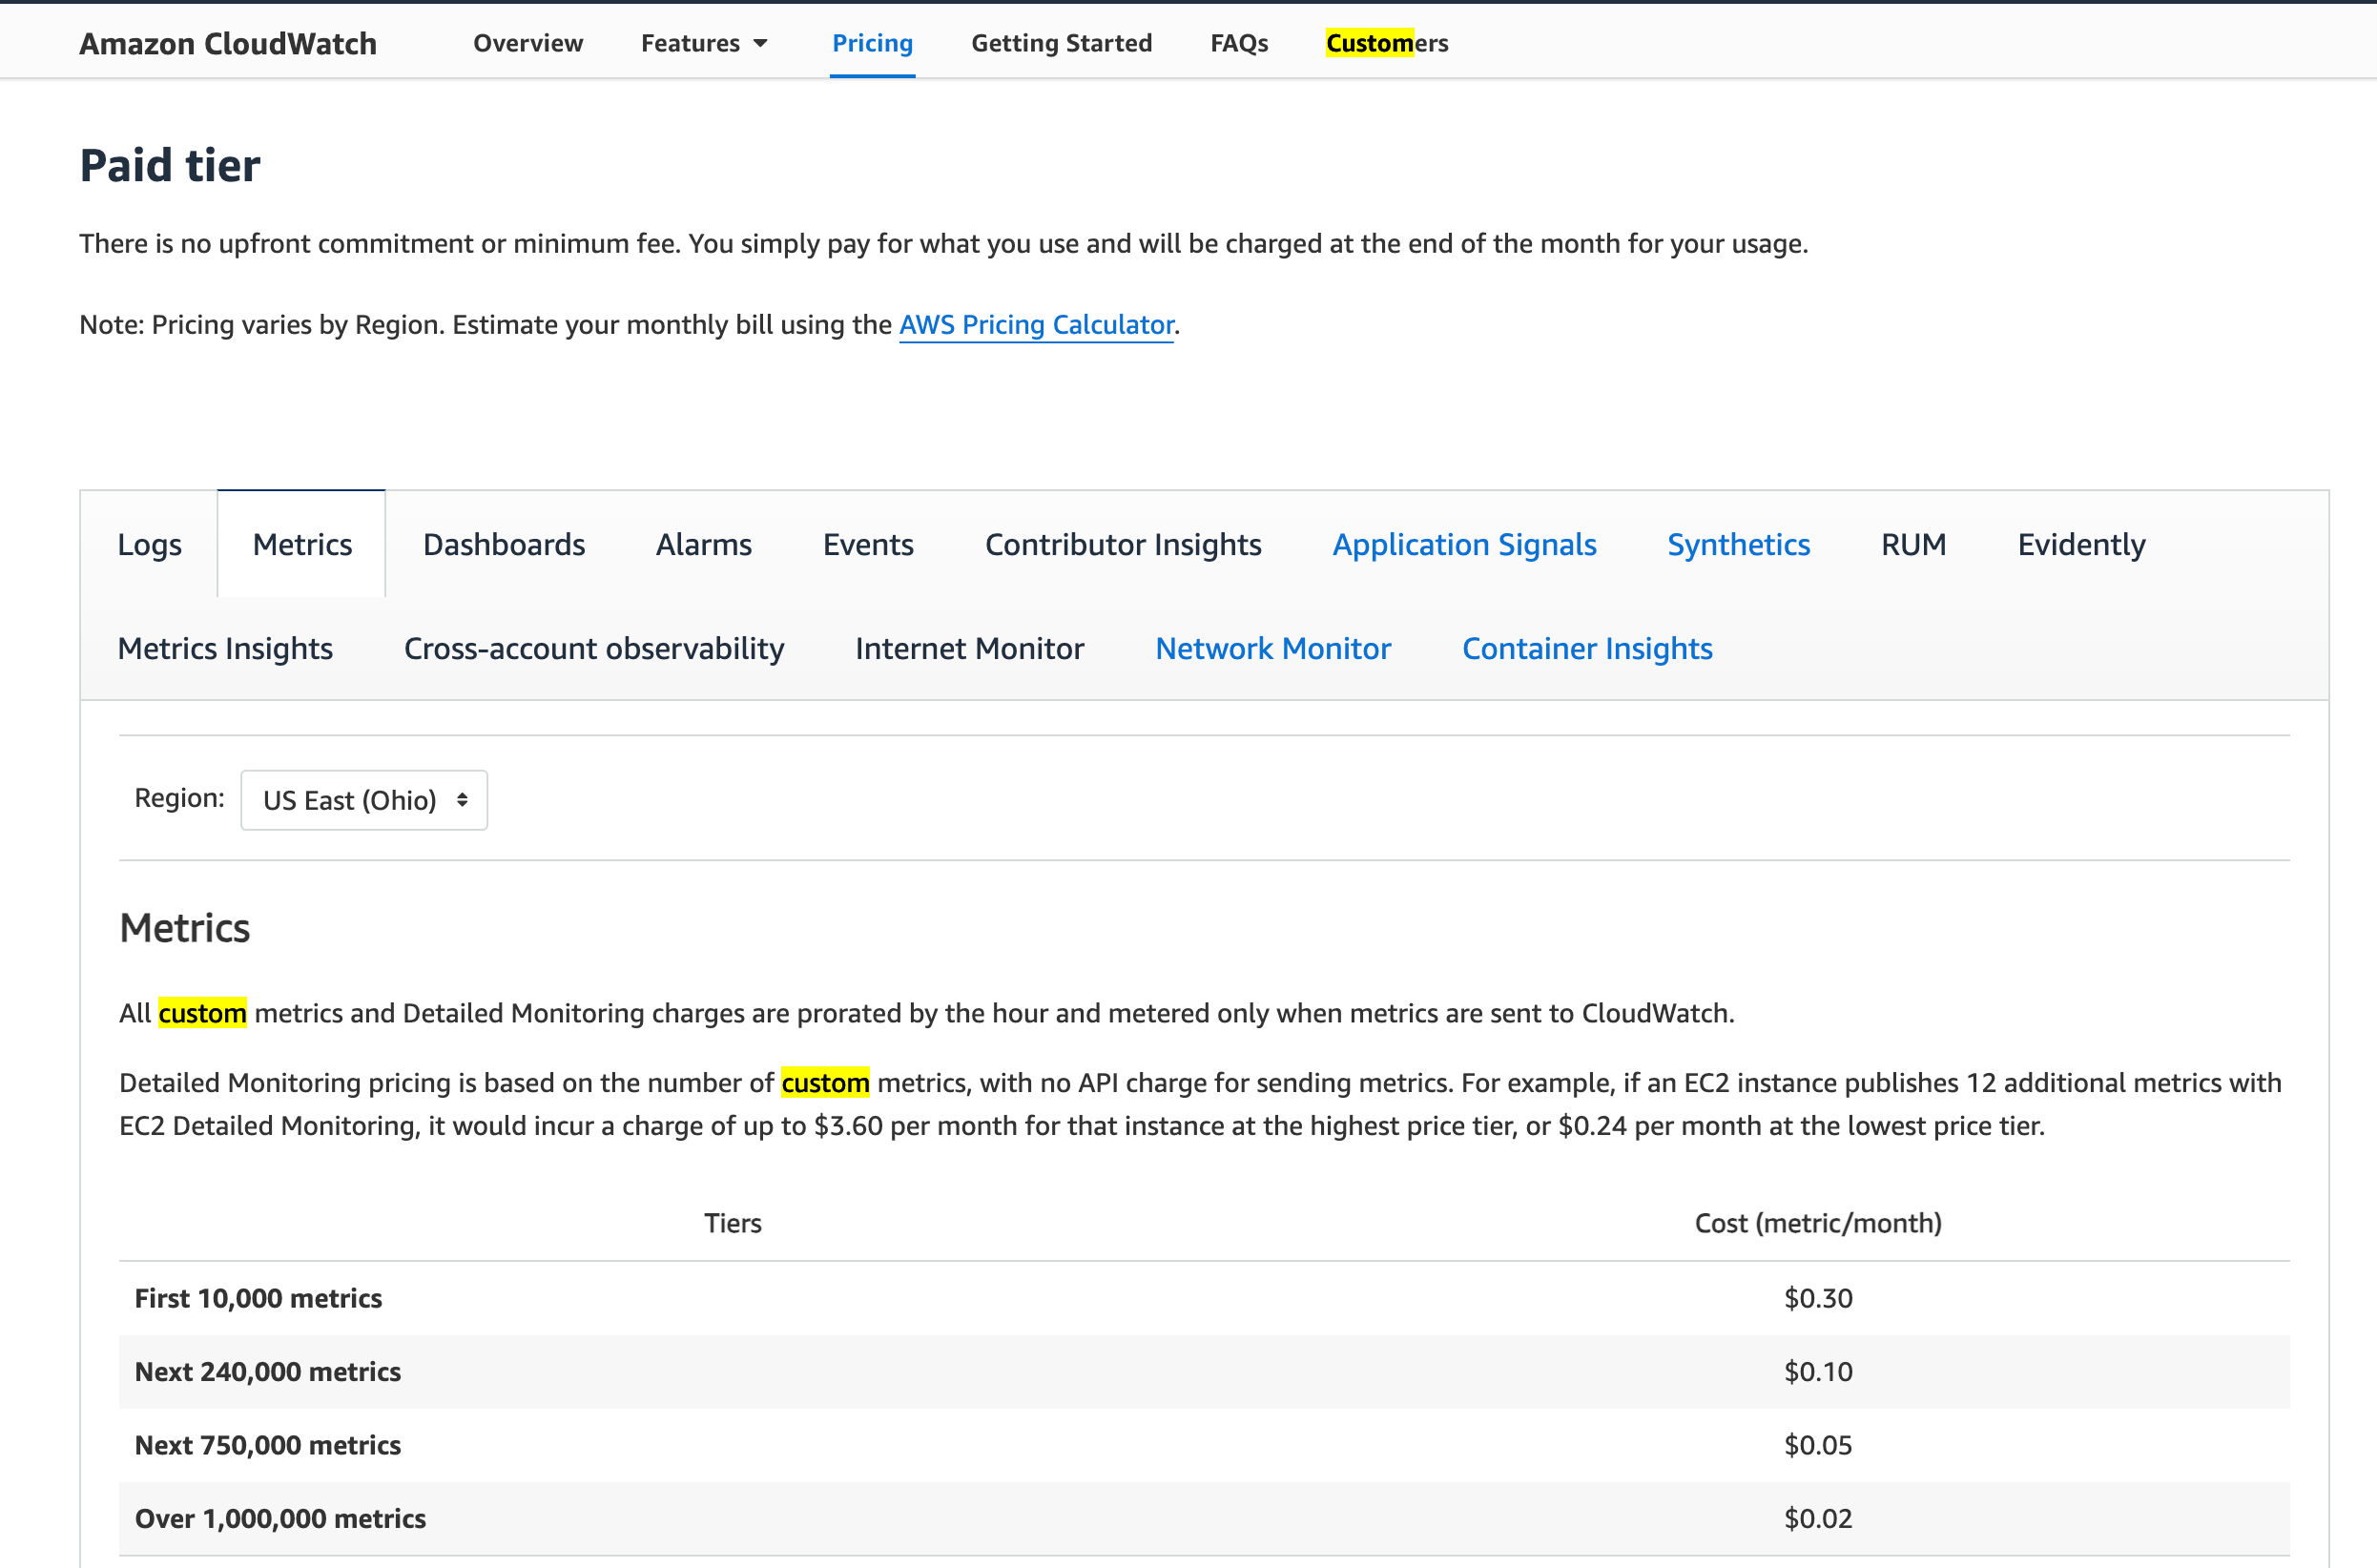
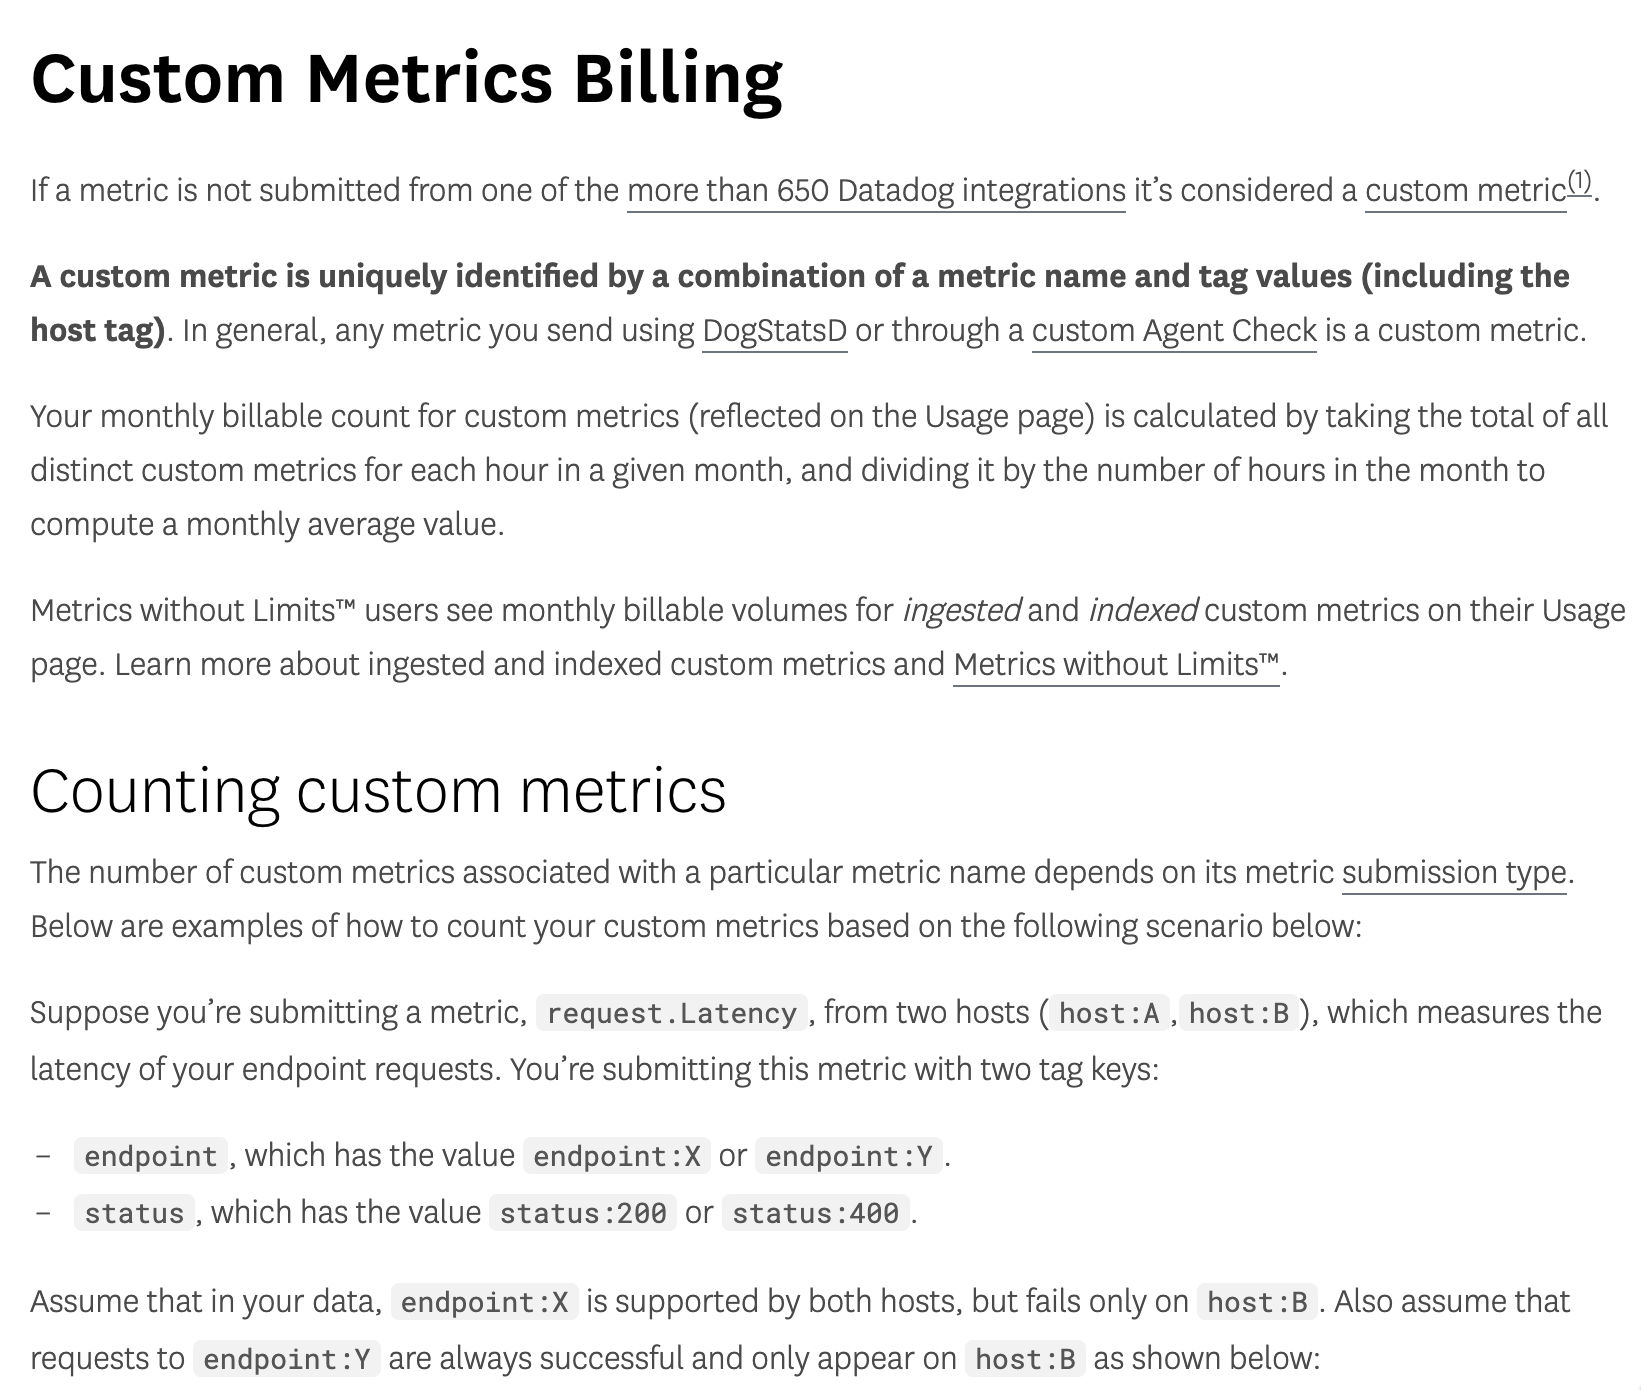
Even the billing example about custom metrics makes no mention of dimensions, namespaces, or units.
_W_zW2avg2.png?updatedAt=1705256303046)
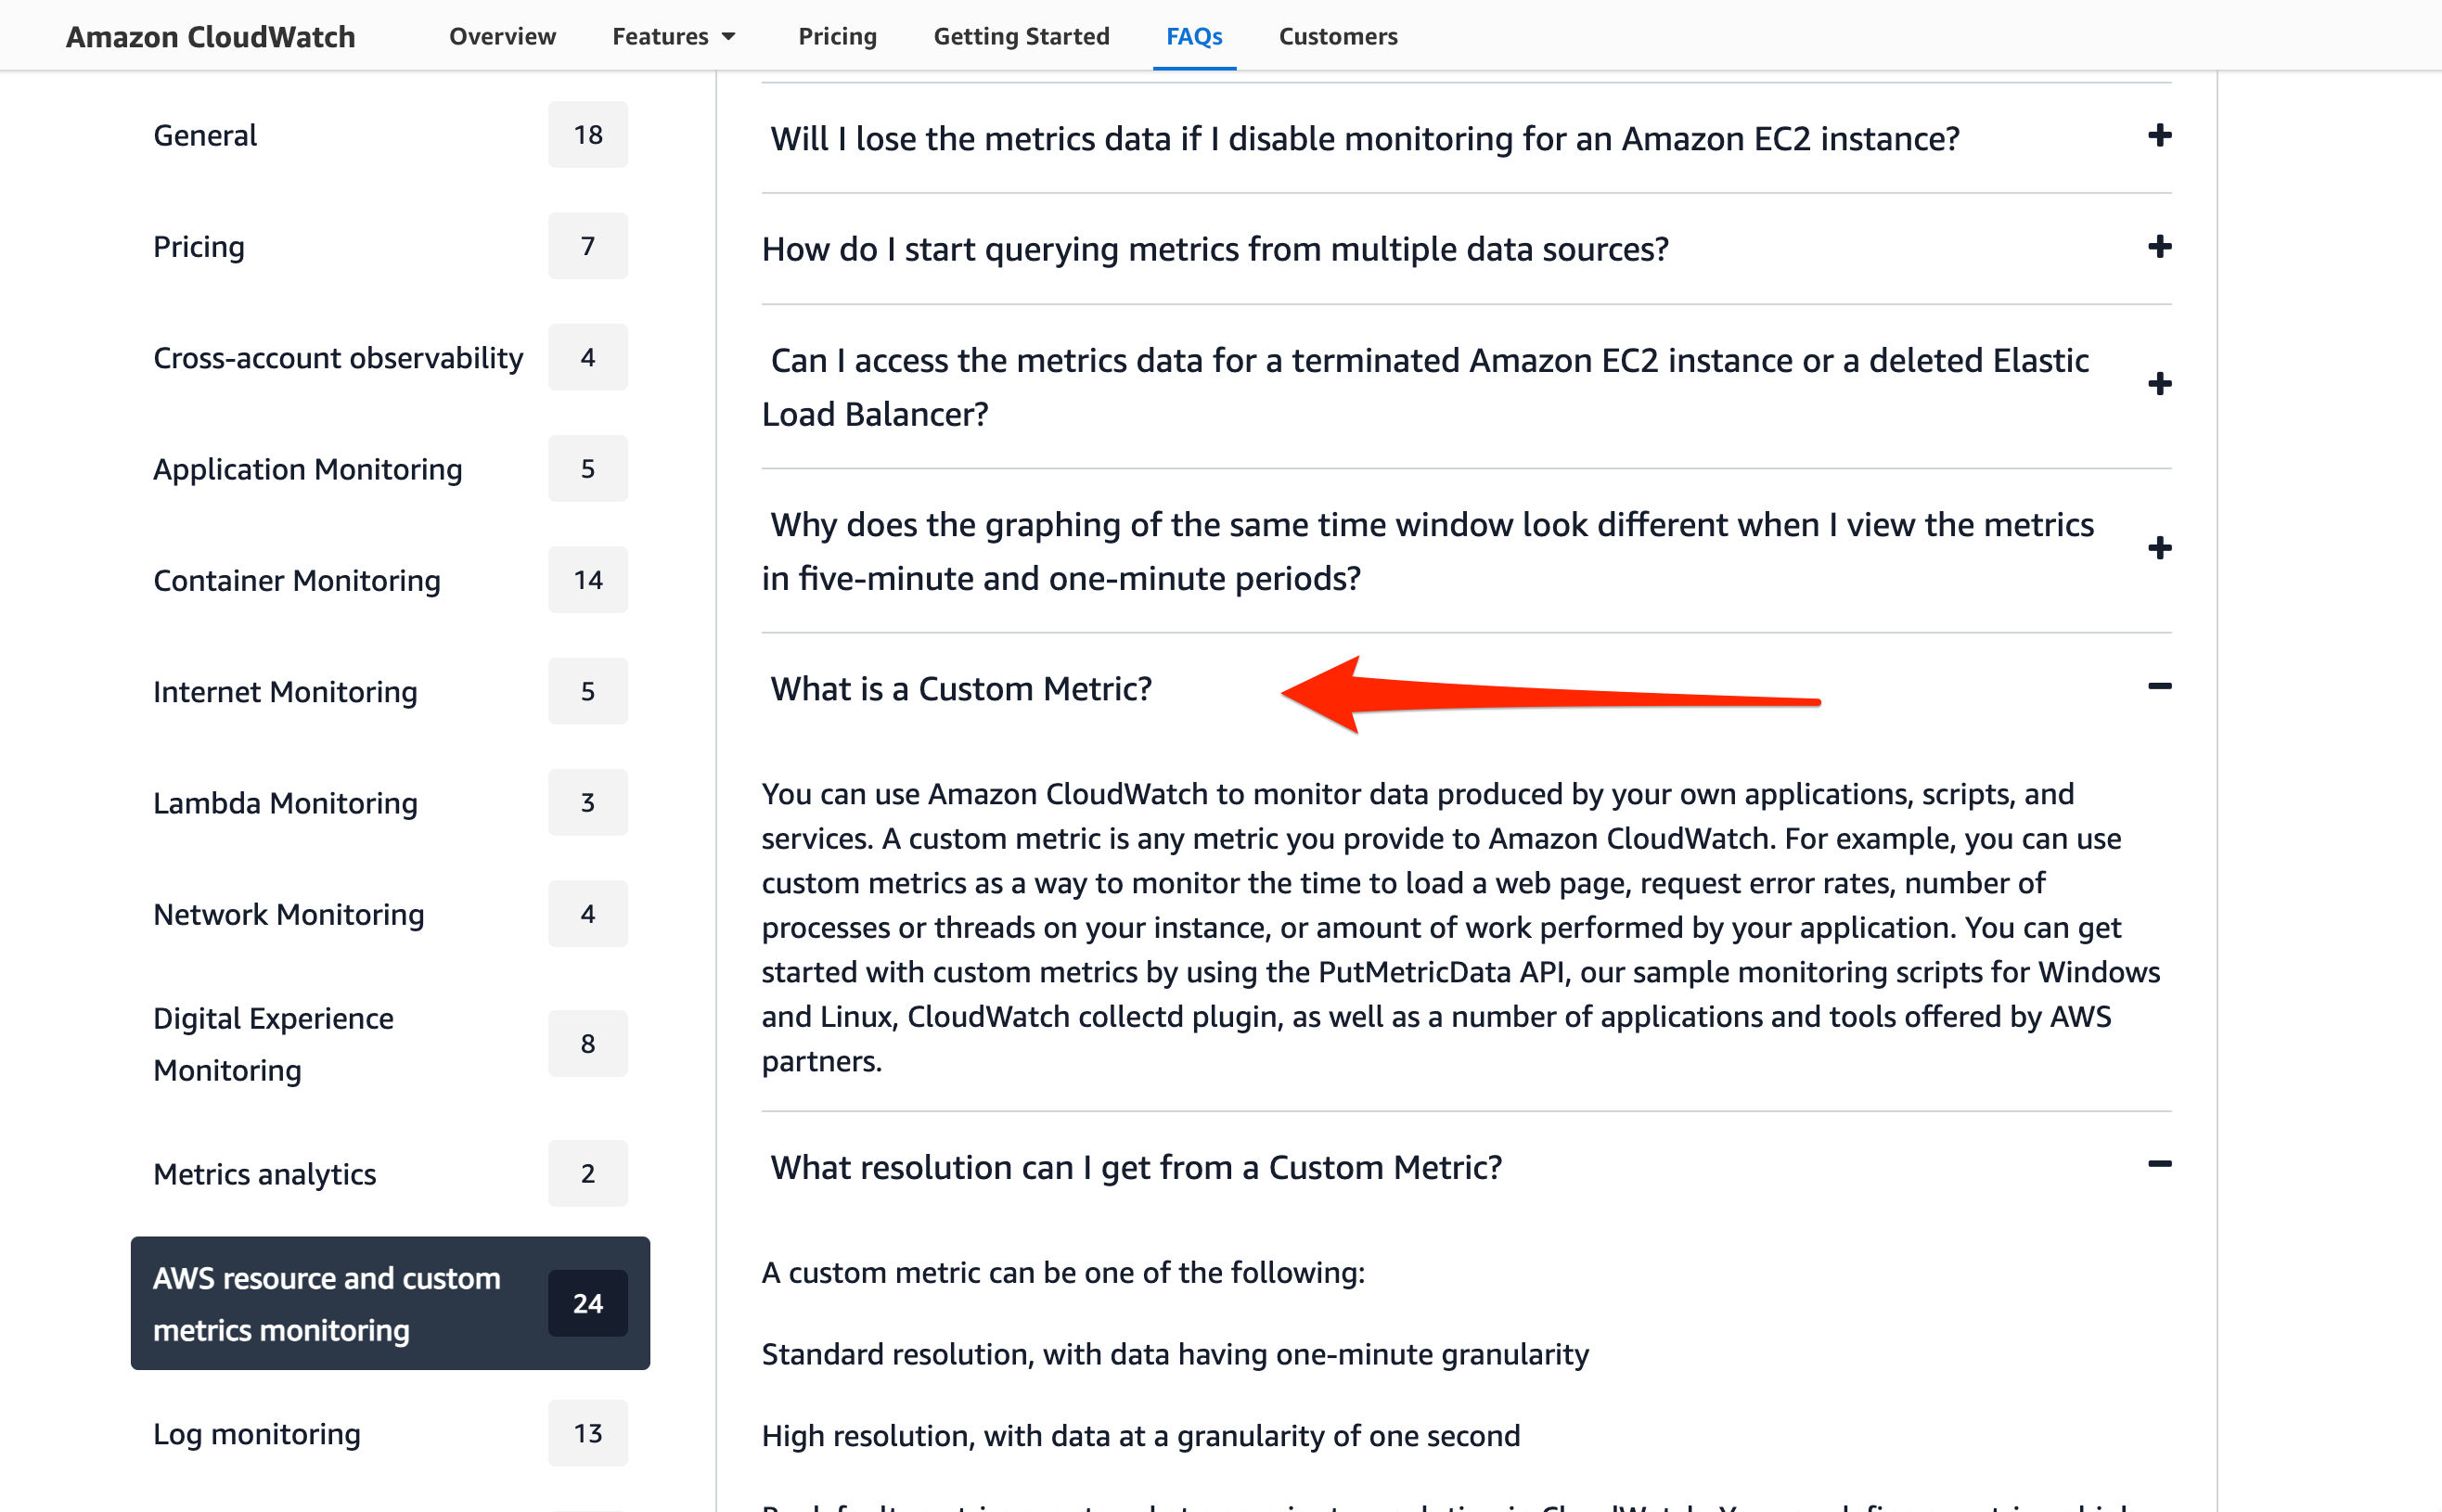
I then navigate to the the billing faq. This has a section literally titled "What is a Custom Metric?" There are a lot of words that say nothing about what counts as a custom metric.
Since I've exhausted all the regular channels, I resort to using Amazon Q.
Me:
what is a cloudwatch custom metric
Amazon Q
A CloudWatch custom metric allows you to publish your own application and system performance metrics to CloudWatch. You can define custom metrics and publish values to them using the AWS SDKs, CLI, or CloudWatch API. Some key things to know about custom metrics: 1. Custom metrics have a name and can optionally have a unit of measurement like "Bytes" or "Count". 2. You publish values to a custom metric over time. CloudWatch stores these values and allows you to view charts and get statistics over time. 3. Common uses include application metrics like request counts, error rates, and latency. You may also publish system metrics like CPU or memory usage. 4. To publish a custom metric, you call `put-metric-data` and specify the metric name, value, and timestamp. For example:5. CloudWatch aggregates and stores the custom metric data, then you can use APIs like `get-metric-statistics` to retrieve and analyze the values over different time periods.\ Sources\ [1] [Publish custom metrics - Amazon CloudWatch](https://docs.aws.amazon.com/AmazonCloudWatch/latest/monitoring/publishingMetrics.html)\ [2] [Specification: Embedded metric format - Amazon CloudWatch](https://docs.aws.amazon.com/AmazonCloudWatch/latest/monitoring/CloudWatch_Embedded_Metric_Format_Specification.html)aws cloudwatch put-metric-data --metric-name "RequestCount" --namespace "MyApplication" --value 100
Getting frustrated now, I do a google search.
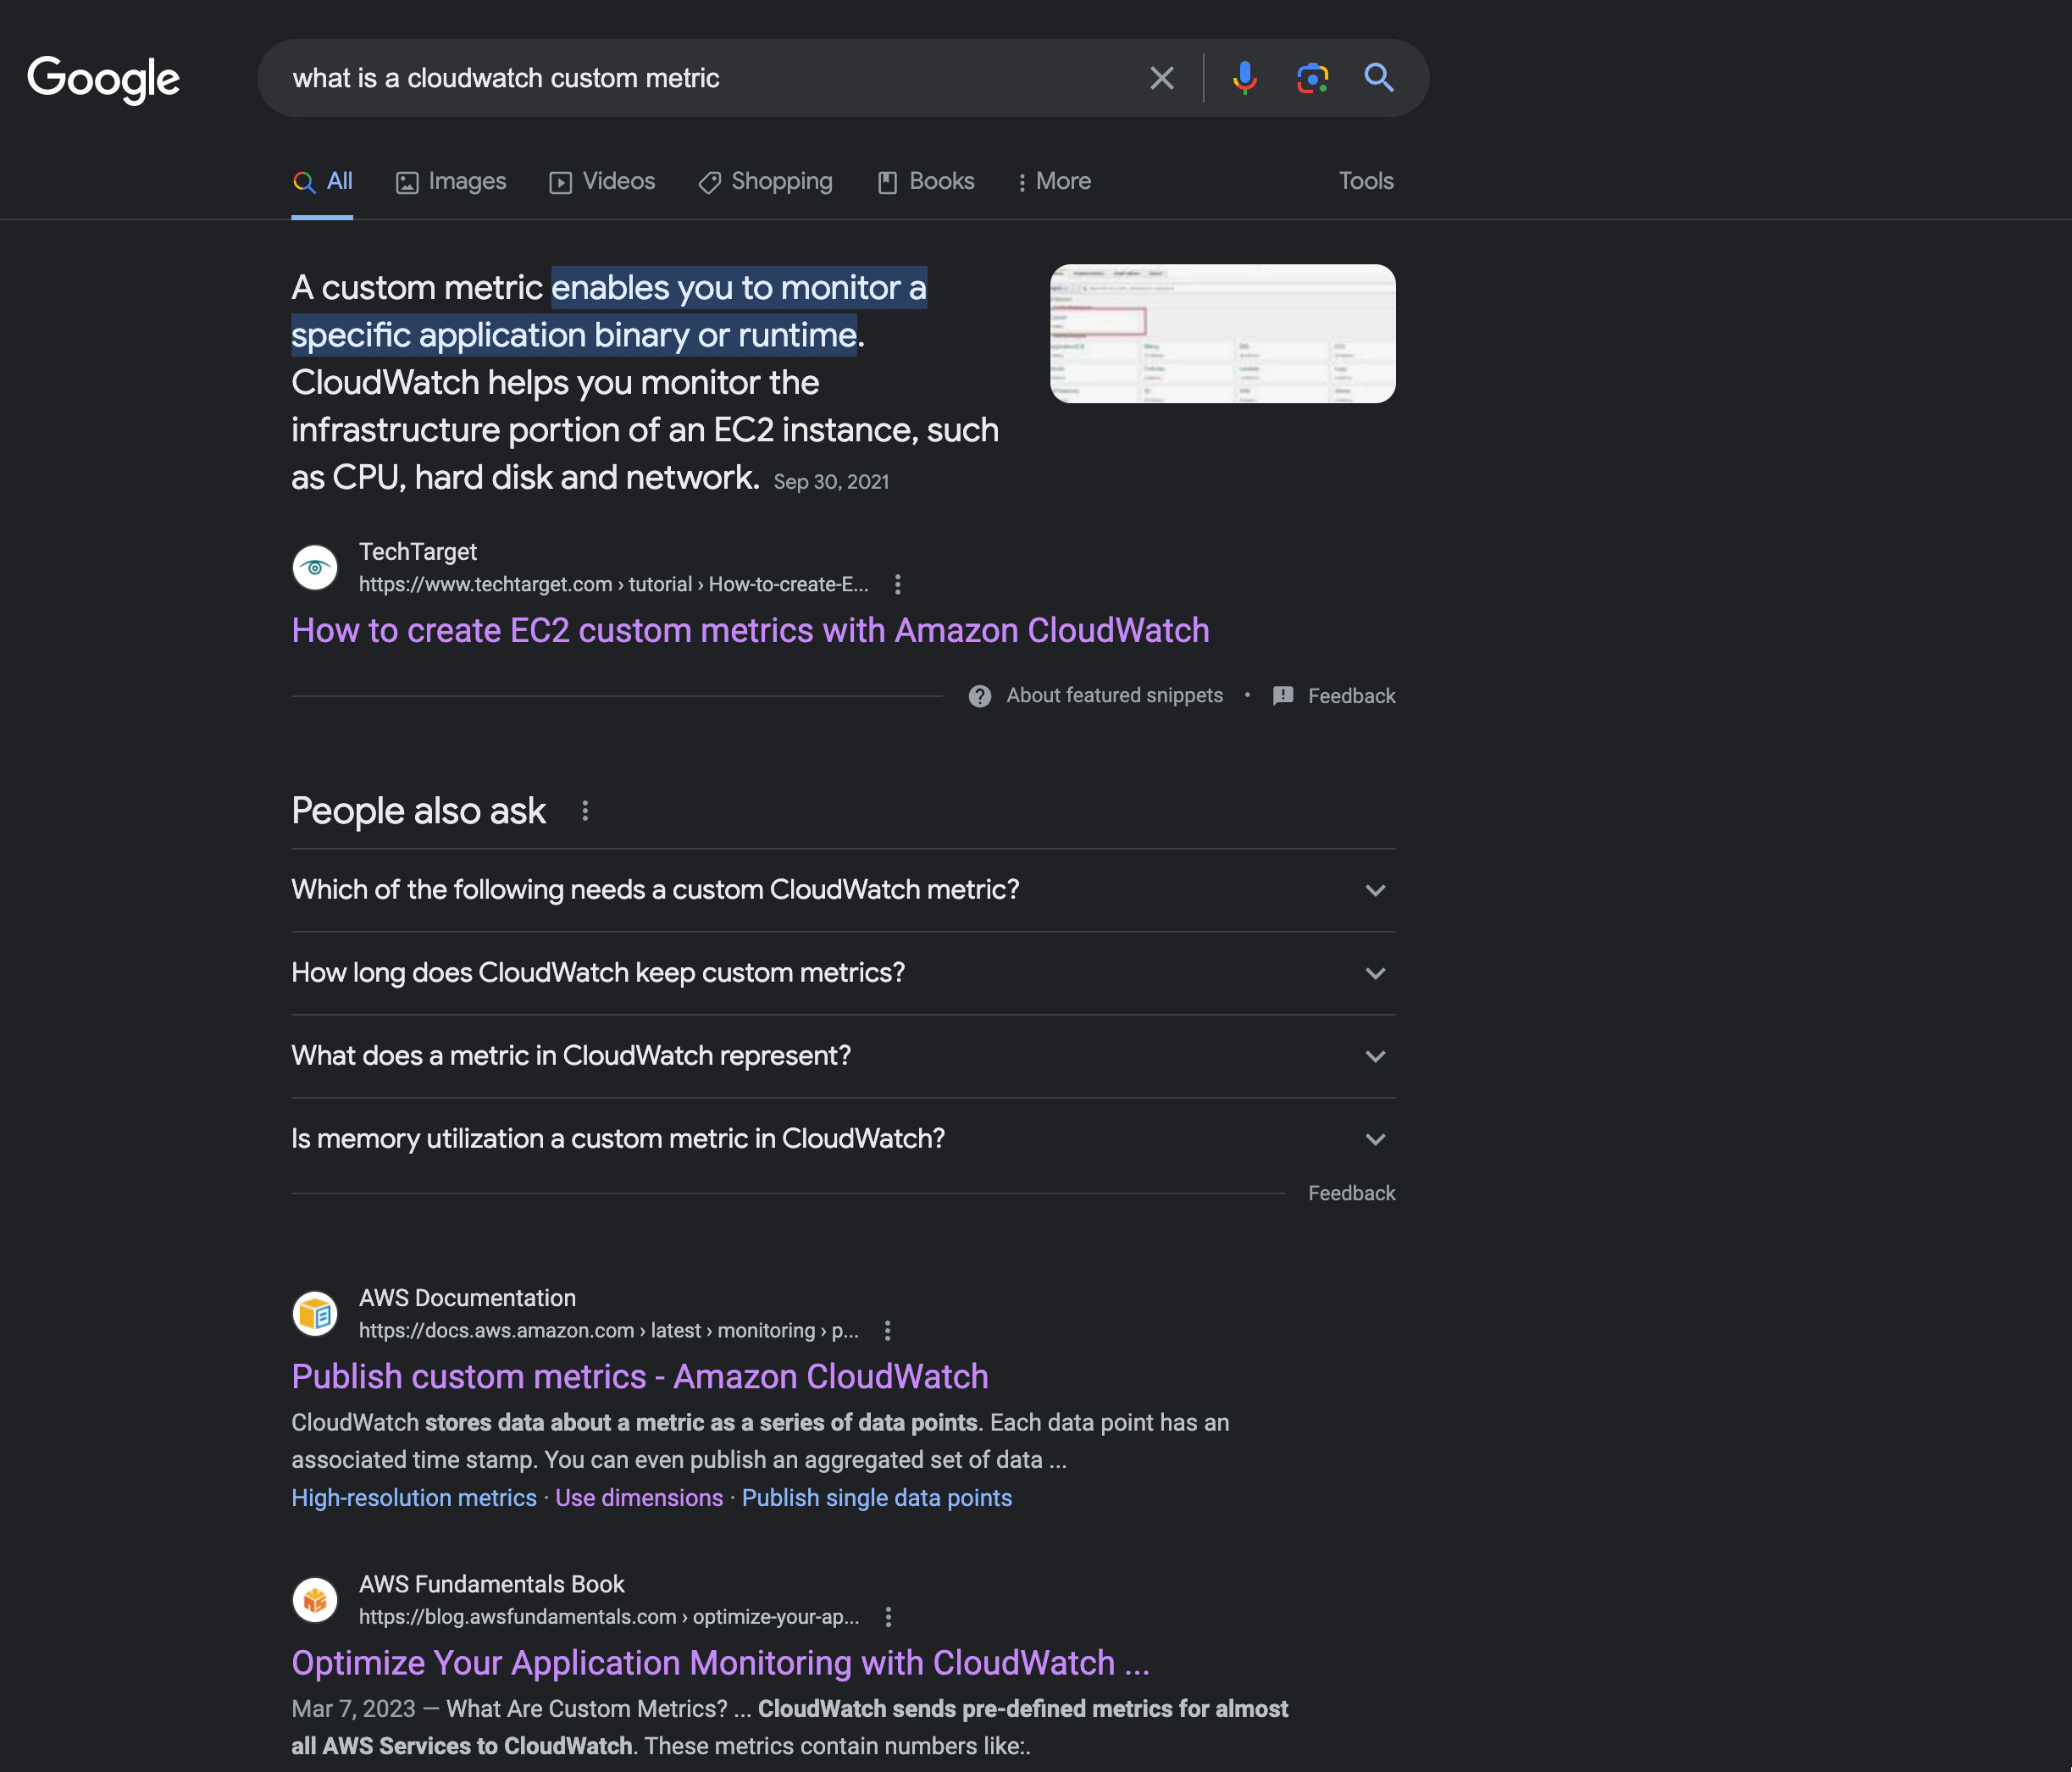
No answers in any of the links above the fold. Now I'm starting to think this is a conspiracy. After more digging, I eventually find the answer in the cloudwatch concepts page
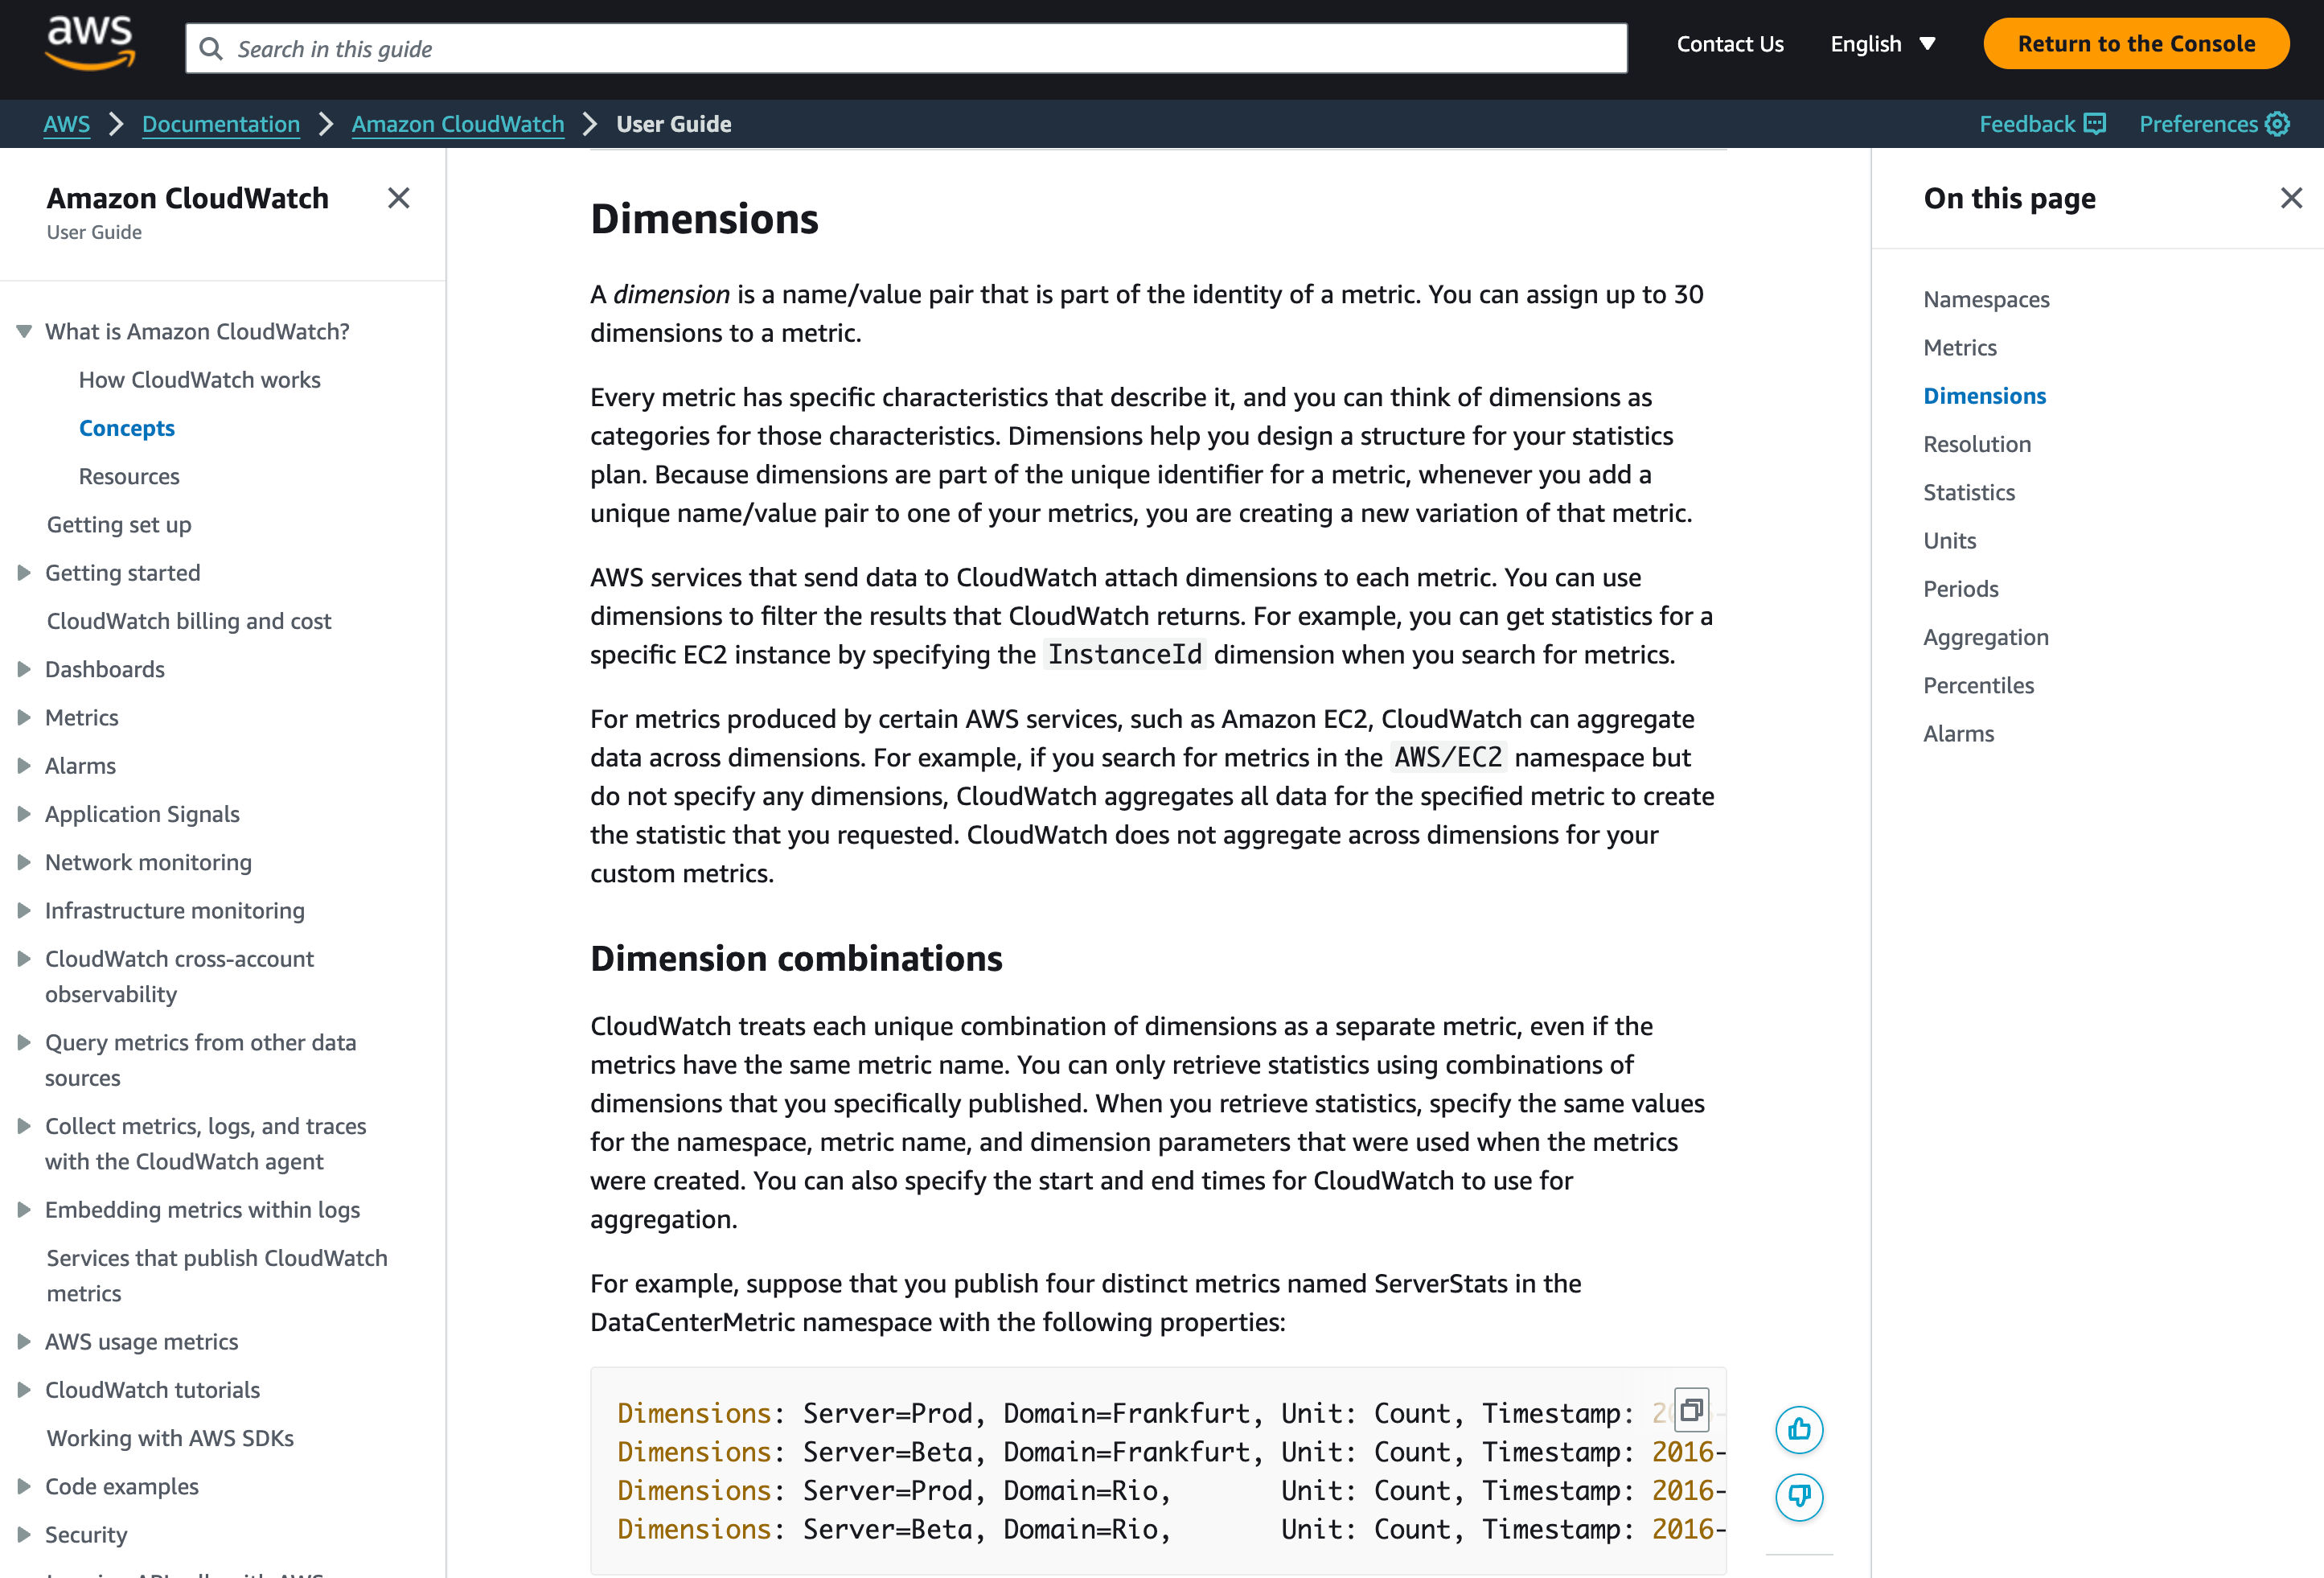
NOTE: Note that this isn't even a great answer. The documentation explicitly calls out that different dimension combinations are unique metrics but doesn't make this clear about namespaces or units.
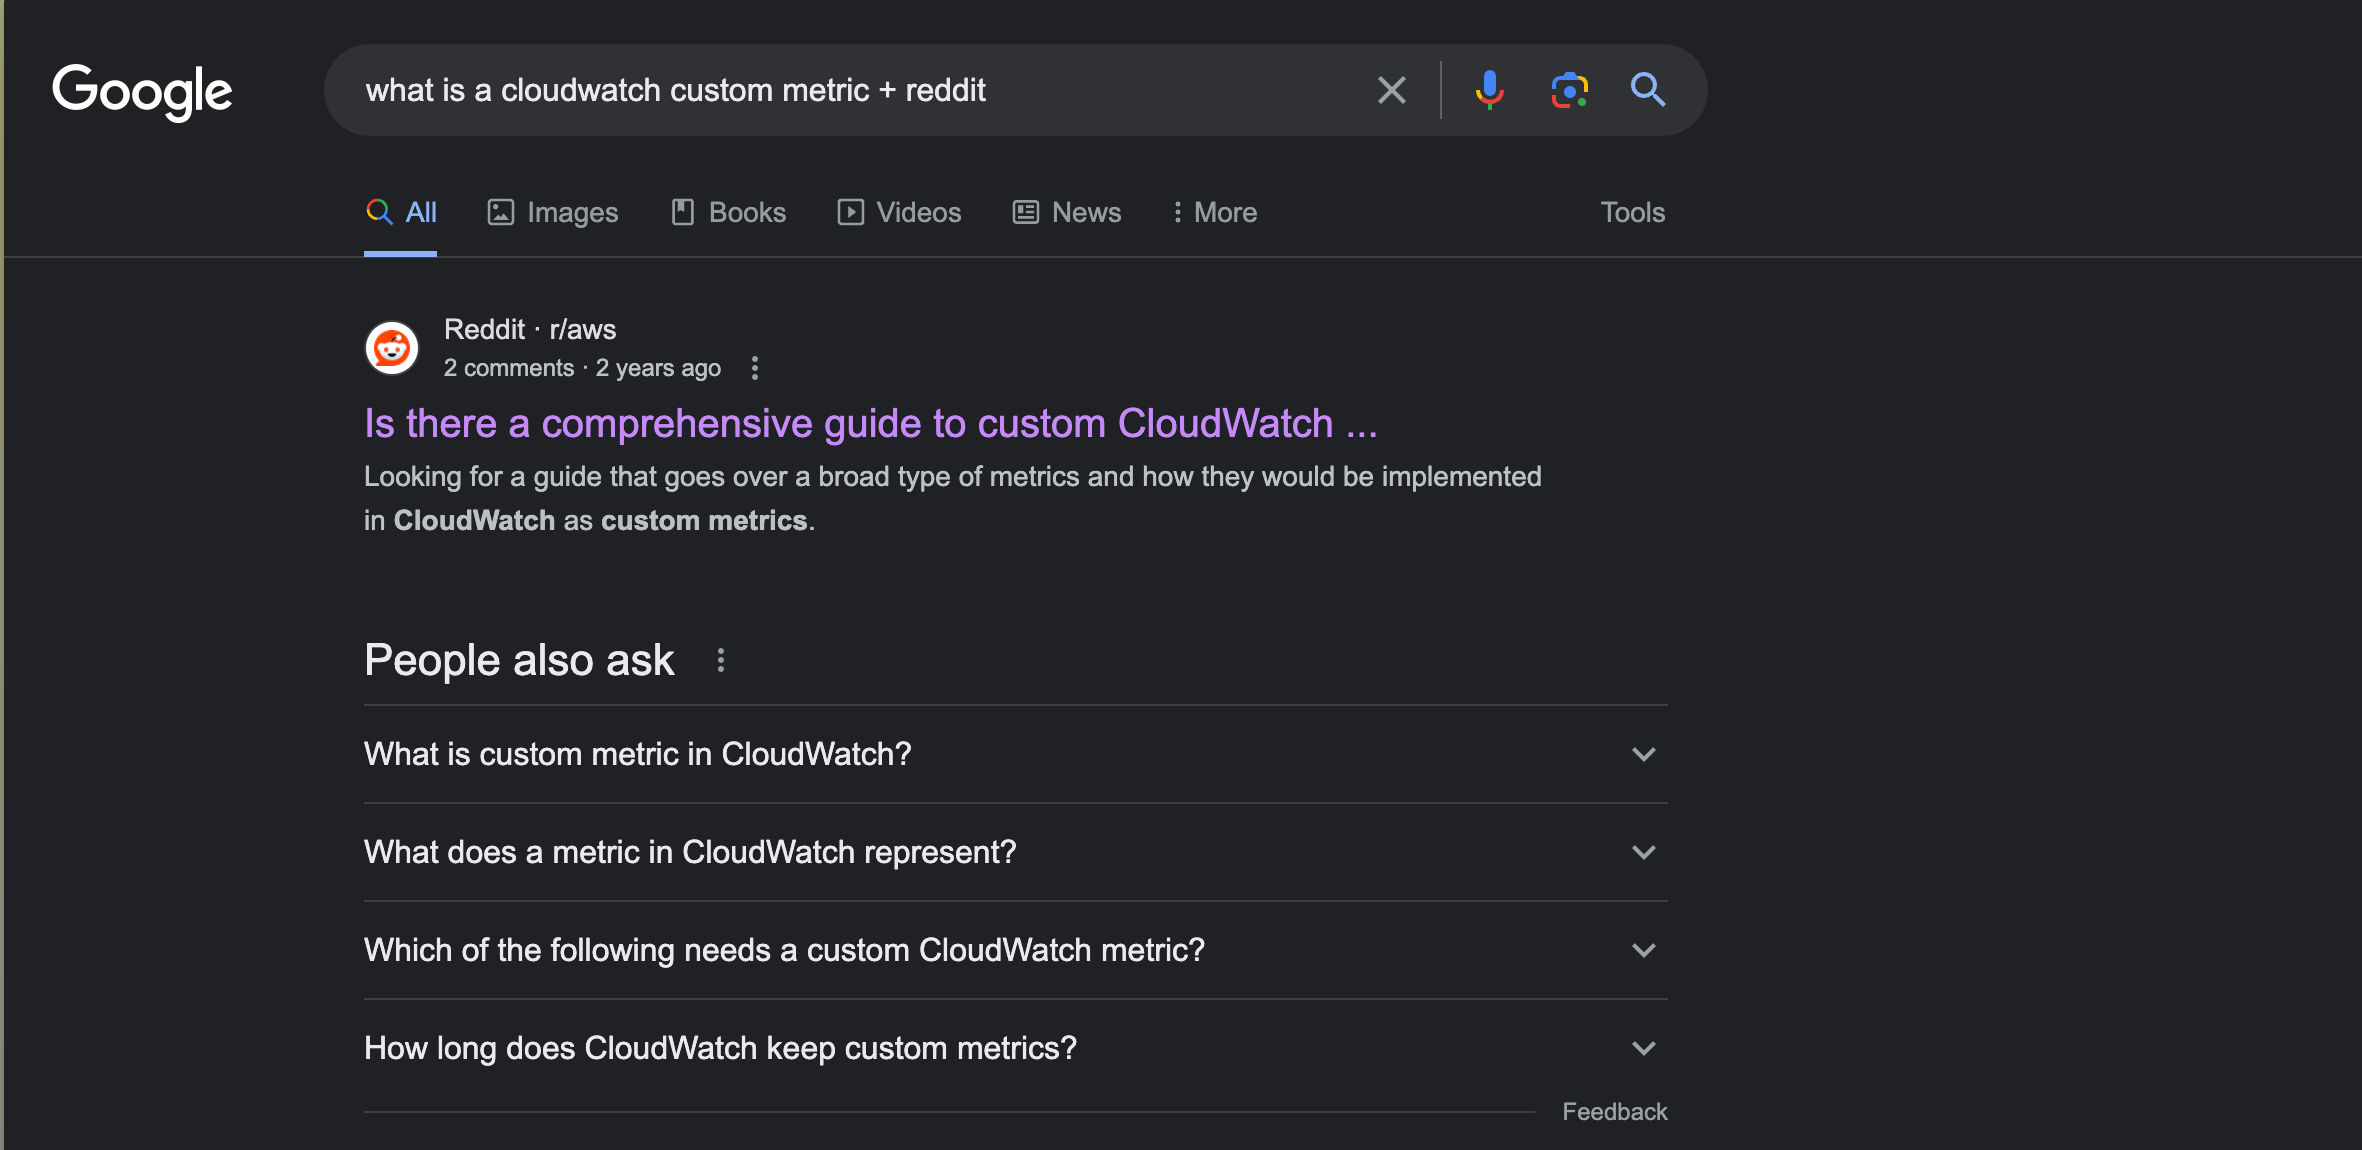
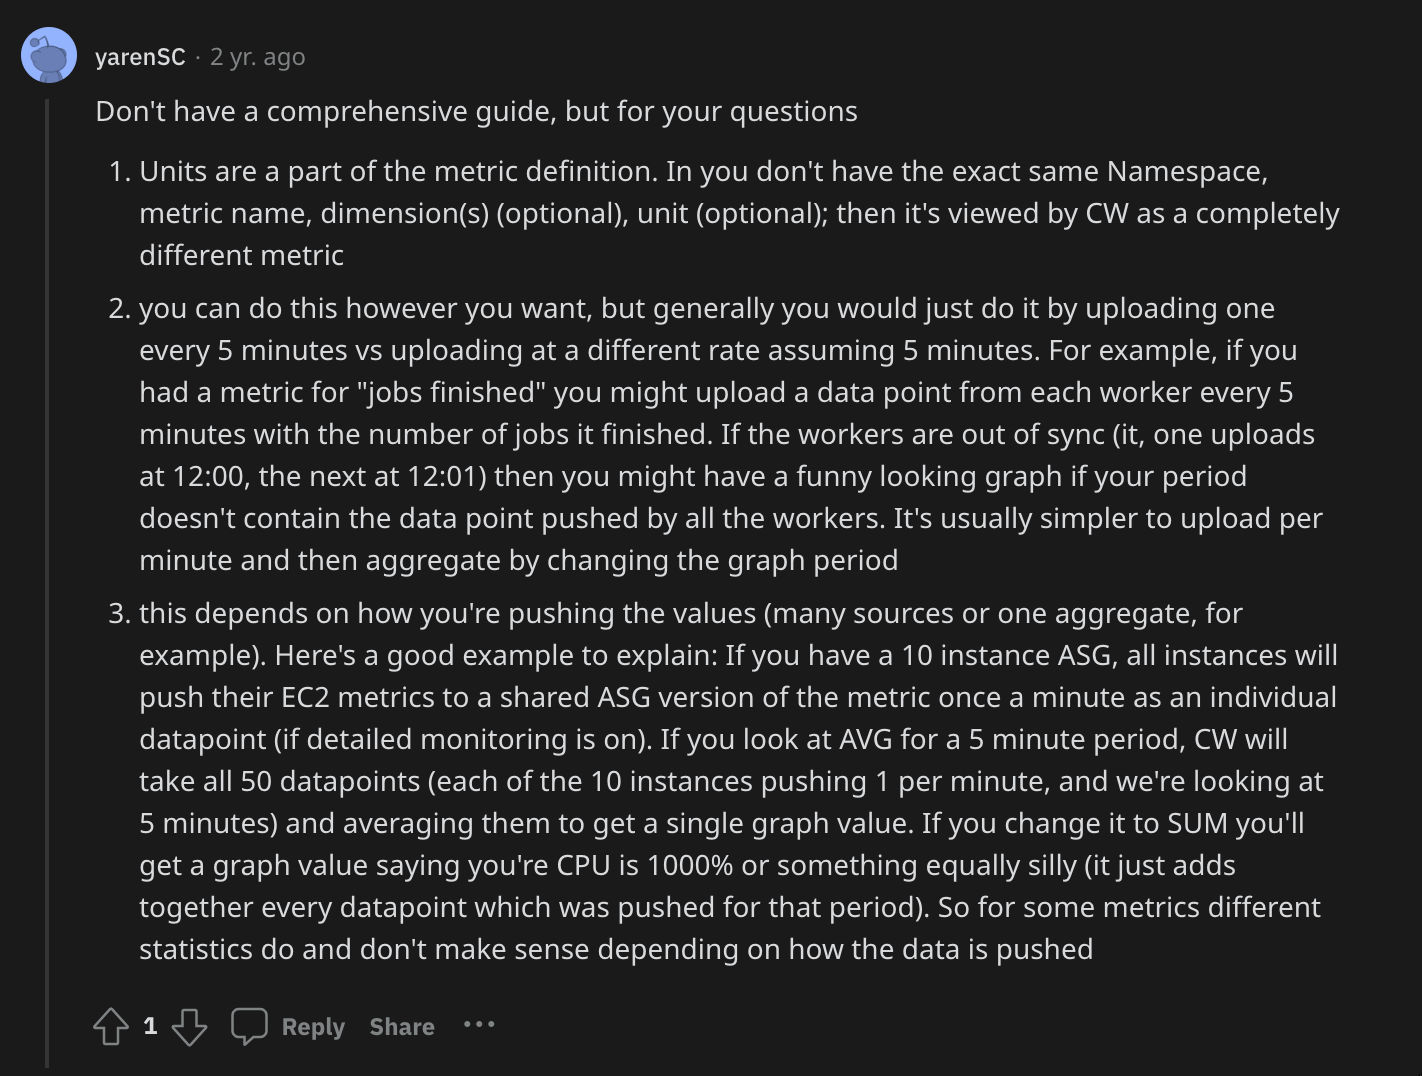
ps. Just for fun, I retried the google search with "+ reddit". Lo and behold...
pss.datadog by contrast does a great job at explaining what a custom metric is upfront
Related
Created 2024-01-14T18:45:29.597000, updated 2024-01-14T19:03:29.939000 · History · Edit